
For one final time, this is my yearly luck post! My favorite post of the year, this post looks to quantify luck and see if the Devils were lucky or unlucky this year. It also comes with a farewell as my final post for this blog. I hope you check it out!
I have been writing for All About the Jersey/In Lou We Trust since 2014, and for most of those years, I have written a yearly post about luck. It is my favorite post I write each year, one I enjoy diving into and analyzing. Luck is obviously an important part of any sport, and hockey is no different. As fans, we inherently know this. Some teams are superior, but when it comes to the playoffs, they get snakebitten, or goalies let up a few goals on unlucky bounces that send them home. Or, looking at it the other way, teams that barely make it in get a red-hot goalie and go a lot further than they would have. Teams can plan all they want, look at all the analytics, put together the best team, but they can still be foiled by luck. That is what makes it so interesting.
Today, after 11 seasons writing about my favorite team, the New Jersey Devils, this will be my last post. I will be joining John in retiring from this blog. However, I didn’t want to spend it just reminiscing, I wanted to write a somewhat normal post too. So, before I get into my farewell, I wanted to write my yearly luck post. I hope you enjoy it and get something out of it.
So let’s get into it! For those who might not have read this post in years past, this is an attempt to quantify luck in hockey and look at how it affected the Devils this past season. I initially got the idea for this post from Rob Vollman’s Hockey Abstract. He released the book back in 2014, the year I started writing for this blog. John was nice enough to get each of the writers of the blog a copy of the book back in the day, and I enjoyed diving into the analytical approach to hockey. In it, Vollman discusses how to quantify luck. He says that luck can be boiled down to 5 statistics. When you look at those 5 stats for a team, you can see if they were lucky or unlucky. It is not a perfectly quantifiable measure of luck, I don’t think that exists or will ever exist. You cannot perfectly quantify certain aspects of the human condition, and luck is one of those aspects. Nonetheless, I think it does a really good job, all things considered, and it gives us a general idea of whether or not the Devils were lucky or unlucky in a season.
To summarize it, luck can be looked at through these 5 statistics: PDO, Special Teams Impact, injuries as measured by CHIP, record in post-regulation games, and record in one-goal games. I’ll describe what each one is as we get to it, and we will see how the Devils fared in each stat this season. Let’s get started!
PDO
PDO is the easiest of the five to visually see and research, as it is a statistic regularly tracked by any hockey statistics website. It is a stat that tends to symbolize luck, so it makes sense that it is on this list. It might not be the entire picture of luck, at least I don’t think so, but it is a stat that is intended to track luck to some degree. Simply put, it is the combination of a team’s shooting and save percentages at 5 on 5 play. When added together, luck-neutral teams should have a PDO around 1.00. Anything significantly under that, and a team was unlucky. They could have been snakebitten, or their goaltending could have been particularly poor for a stretch. On the other hand, anything significantly over 1.00, and a team was lucky with either an overly inflated shooting percentage, or a goalie that was absolutely on fire. This is where Carolina usually crumbles, with poor team save percentage, although in this playoffs, Frederik Andersen seemed to be a tonic for the first two rounds at least before everything crumbled.
This season, according to Natural Stat Trick, the Devils ended with a PDO of 0.996. This ranked them 18th in the league in PDO. The luckiest team was Winnipeg at 1.025, and the unluckiest was Nashville at 0.970 (the aforementioned Canes were at 0.983 by the way). Within that 0.996 PDO stat for New Jersey, the team’s shooting percentage at 5v5 was 8.50%, and the team’s 5v5 save percentage was 91.14% (0.085 + 0.9114 = 0.996 PDO). Overall, this is a fairly luck-neutral number for PDO. It is ever so slightly under the pure luck-neutral 1.00, but it is very close. NJ’s shooting percentage at 8.5% was the number that dragged the PDO below 1.00, as that shooting percentage ranked 22nd in the NHL.
Overall, however, the Devils’ PDO was luck-neutral.
Special Teams Impact
Special Teams Impact works similarly to PDO, as it takes two stats and combines them to give an idea of luck. But whereas PDO is a luck stat for 5 on 5 play, Special Teams Impact looks at all power play and penalty kill situations. It takes a team’s power play and penalty kill percentages and combines them. The closer a team was to 100%, the more luck-neutral they were in these situations. Anything over 100%, and the team was lucky in special teams situations. Anything below, and they were unlucky.
In 2024-25, according to NHL.com, the Devils ended the regular season with a power play percentage of 28.2% and a penalty kill percentage of 82.7%. This puts their Special Teams Impact at 110.9%. Without a doubt, the Devils were lucky in this stat. Their power play percentage ranked 3rd in the league, and their penalty kill percentage ranked 2nd. That is incredible, plain and simple. They had a relatively dominant power play and an even better penalty kill. That is very rare for this team, and in all the years I have done this post, this is the best STI I have seen for the Devils. It will be very interesting to see if the team can recreate this special teams success next year and beyond, and what will happen to the assistant coaching staff if they keep succeeding at this level. You would have to think they might be poached for head coaching candidacies if the team remains this good at special teams.
Overall, in this stat, the Devils were lucky.
CHIP
To me, this is both the most important and most interesting of the five stats in this post. CHIP stands for the Cap Hit of Injured Players, and it attempts to analyze the impact of injuries on a team. Injuries have a massive impact on a team year over year, and they are basically just luck. You might want to contribute some of it to a good training team, preparation, and whatever remedies teams use to keep players healthy, and that is a fair argument. However, most of it is undoubtedly luck. This is especially true when you consider who gets injured, and this is where CHIP is so good. Analyzing injuries by using salaries and cap hits is generally superior to simply counting man-games lost due to injury because it helps to analyze the impact of injuries on better players. If Jack Hughes misses 20 games due to injury, as he did this past season, that is way more impactful on the Devils and their chances of winning than, say, the 34 games that Curtis Lazar missed. But if you just count man-games lost to injury, that stat would show the 34 missed by Lazar as being more impactful, when that is clearly not the case. But when looking at CHIP, Jack’s $97,561 per game cap hit is way more impactful than Lazar’s $12,195 per game, as it should be.
To find CHIP, a great resource is the NHL Injury Viz. Their visuals really simplify this stat and show it in a great chart. You can also hover over the bars in the graph for more information. I recommend clicking the link and checking it out for yourself. Here is the CHIP chart for 2024-25: (Note: the bigger the bar, the larger the CHIP, the more impactful injuries a team had this past season)
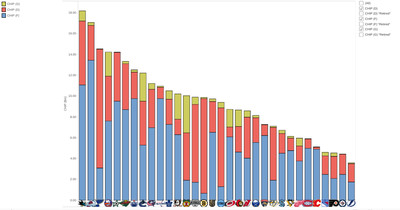
Based on the chart, even with the loss of players like Jack Hughes, Dougie Hamilton, Jonas Siegenthaler, and Jakob Markstrom at different times, the Devils were actually one of the healthier teams in the league overall, although they were not super healthy either. They were the 13th healthiest team over the 82 game season. They lost $4.04 million in injuries to forwards, $3.92 million to defensemen injuries, and $0.62 million to goaltender injuries. To further analyze, here is the CHIP chart on a per-game basis for the Devils:
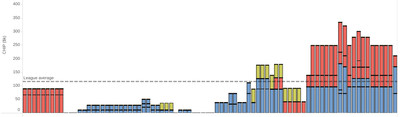
As you can see, the Devils were incredibly healthy in the first half of the season. From games 10 through 42, there were incredibly few injuries, mostly just Curtis Lazar and Nathan Bastian for a little bit, and 3 games from Jake Allen. Otherwise, they were golden. But the real killers were with the Markstrom injury from games 51 through 61, and then, even worse, the Hughes and Hamilton injuries for the final 20 games or so. Those two injuries in particular skyrocketed the Devils’ overall CHIP. Without those two injuries, they would have been extremely lucky with injuries this season. As it was, however, they only ended up being mildly lucky. And you could even claim that, thanks to the timing of those injuries, keeping Jack out of the playoffs specifically, it negates any luck the team had from CHIP earlier in the season, and I would be inclined to agree with that line of reasoning.
For those reasons, I can’t claim the Devils were unlucky with injuries, because they were so healthy for the first two-thirds of the season. But overall, I would declare the Devils luck-neutral in CHIP this year.
Post-Regulation Record
The final two stats revolve around close games. Tight games can often be decided with some form of luck involved. A fluky bounce of the puck that goes in the net, or a fluky bounce that prevents an otherwise surefire goal, these can all happen in close games to help decide the outcome. Not all close games are going to be specifically decided by luck like this, but you know luck plays a part in all of these games, so it is worthwhile to track these when looking at luck. If the season were shorter, this would be less effective to look at, but over 82 games, enough close games occur that tracking close games is a decent indicator of luck. Luck-neutral teams will be about .500 in close games, and there are two stats to look at.
The first of the two looks at games that go beyond regulation. Three-on-three has more of a measure of skill involved, but even still, many are often decided by a rogue breakaway, and those can be generated at least in part by luck. Shootouts are extremely luck-driven. This SBN post from 2014 goes into how much of the NHL shootout is driven by luck, and that has not changed in the decade since. Therefore, looking at a team’s post-regulation record gives us a decent indicator of luck. Teams should be about .500 here, especially in games that go to shootouts.
This season, the Devils played in 13 games that went beyond regulation, not including the two double-overtime games in the playoffs. 9 of those 13 games were decided before a shootout, and in those, the team went 4-5. In the four shootout games, the team went 2-2. So, overall, New Jersey was 6-7 in games that went beyond regulation, 7-8 if you want to include the playoff games. Overall, this is basically luck-neutral. They played in an odd number of post-regulation games, so they couldn’t finish at exactly .500, which means this is as close as they could get. They were not incredibly unlucky in the shootout, like way back in 2013-14 when the team went 0-13 in the shootout and missed the playoffs because of it. Post-regulation games did not hurt or help the Devils this season.
So, overall, in post-regulation games, the Devils were luck-neutral.
One-Goal Games
This one is very similar to the last one. Rather, instead of games that went beyond 60 minutes, this looks at games that finished in regulation but were decided by only one goal. The rationale for this is the same as before: one goal can be fluky for a number of factors, so close games like this should go for your team about as often as they go against you. You might argue that more skillful teams should come out on top a little more than at a .500 clip, and that is fairly reasonable, but in general, a luck-neutral team should be around .500 in one-goal games.
This past season, the Devils played in 15 one-goal games that did not go beyond regulation. In those, they were 6-9. This is fairly unlucky, but not massively so, with a 40% win percentage in these games. They actually lost to San Jose twice by one goal, which is crazy. But if just one of those games went the other way and they got a win, a 7-8 record would be basically luck-neutral. So they were unlucky here, but not crazy unlucky.
So, overall, in one-goal games, the Devils were somewhat unlucky.
Conclusion
This is honestly the most luck-neutral I have seen the Devils since I started writing these posts each year. In my opinion, the team was basically luck-neutral in three of the five categories. They were very lucky in one stat, special teams impact, and they were slightly unlucky in one stat, one-goal games. You could honestly make a claim about CHIP being slightly lucky or unlucky either way, so I scored it as luck-neutral. And both PDO and post-regulation stats were definitely luck-neutral.
So, in reality, it comes down to two stats. The Devils were very lucky in special teams situations, and a STI of 110.9% is the best I’ve seen for the Devils. Their 40% win rate in one-goal games is unlucky, but only somewhat unlucky, as a 6-9 record is not too far from luck-neutral. When you combine those, the luck of special teams beats out the unlucky one-goal game record, leaving the Devils as having been slightly lucky in 2024-25. They were not very lucky, they did not win thanks to luck. They were not a playoff team because of luck. In reality, they really only got lucky in special teams situations, which are only played for a small percentage of each game.
Nonetheless, it was enough to tip the scales, so I have to claim that the 2024-25 New Jersey Devils were slightly lucky. It is hard to think that way when you realize that Jack Hughes’ injury caused him to miss the playoffs, and that was a huge hit. But this exercise isn’t meant to include the playoffs, just the regular season. And in the regular season, overall, the Devils were a little lucky.
Farewell
And that is it for me. I honestly cannot believe that I have been writing for this blog for 11 years. In 2014, I was in my mid-20s, only two seasons into being a season ticket holder for the Devils, sitting in section 117 and watching the end of Martin Brodeur’s illustrious career. I remember John putting out a post that he wanted more writers, and wanted article submissions that he would post on the site. From those, he would choose a few to write for the blog on a weekly basis. I said why not, and wrote up a post about how the Devils had more than 12 capable forwards, and they would need to figure out how to address the excess talent at the position in the offseason. That article aged like milk, considering the team didn’t make the playoffs for another few seasons yet. But at least according to John, it was good enough to get a spot writing every week alongside Gerard and CJ. It was unpaid at the time, I was just doing it for fun and because I enjoyed following the team and writing about how they were doing.
And 11 seasons later, it has been a true joy to contribute to this site on a weekly basis. Being able to track how the team is doing in more depth than I ever would have otherwise, writing about their boons and busts, and discovering young talent before they became full-time NHLers has been very enjoyable and interesting. It’s made me feel more connected and invested in the team than I ever would have otherwise, even though I still would have tuned in and watched the games. But by contributing to the blog, the articles I wrote tied me even more to my fandom. Never would I have ever felt so invested in eventual disappointments like Eric Gelinas, Steven Santini, Jesper Boqvist, Alexander Holtz, and others. And never would I have felt more connected to eventual successes like Damon Severson, Jesper Bratt, and Dawson Mercer.
Moving forward, I wish the site well, and I am positive that it will continue to thrive. There are a lot of good writers here, and while the Devils’ fanbase isn’t the biggest, it is passionate, and the organization has held out in northern New Jersey for way longer than many predicted. This franchise is here to stay, and it is successful. And knowing my luck, I am sure that some of the best days for this team, and especially this young core of players, are close at hand. The year after I had to give up my season tickets because I couldn’t afford both them and my mortgage, the Devils made the playoffs. So it is only fitting that the year after I leave All About the Jersey, the Devils go on a deep playoff run. At least, that is my hope, and I am willing it into existence right now.
Thank you to anyone and everyone that has read and commented on any of my posts, and thank you to John specifically for giving me a chance to write for this blog. It means a lot to me to be able to contribute to the Devils community, and the fact that some people read and comment on my posts is still truly remarkable to me, all these years later. I am glad to have been a part of this, and that will not go away, even if my weekly posts will be no more. I look forward to continuing to follow the blog and reading about new prospect profiles, new hot takes mid-season, and seeing how the team is performing analytically. Good luck to everyone still writing for the blog, and I especially wish good luck to the New Jersey Devils. May your successes be grand, and may your tenure in New Jersey continue to be great for years to come.
And for one final time, thank you for reading my post today here at All About the Jersey! I encourage you to comment about how luck affected the team this season and how luck can be quantified via statistics in hockey. If this is the last time this luck post graces this blog, I hope it leaves an impression on you and makes you think about luck in hockey as you watch the Devils. Thank you again, and goodbye!